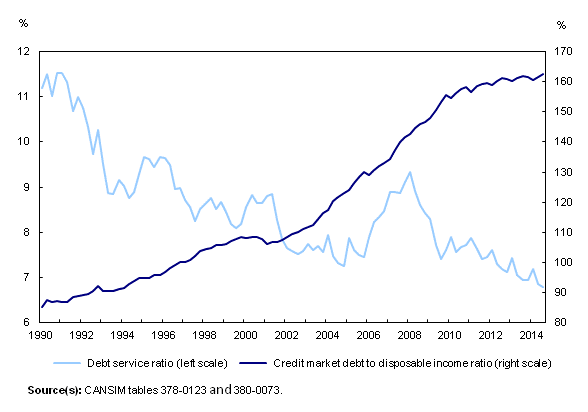
It’s a story that never seems to get any better. The latest numbers from Statistics Canada show that household debt in Canada hit record levels in the 3rd Quarter of 2014. The figures are reported in the latest edition of The Daily from Statistics Canada.
Despite gains in household net worth, households in Canada hold roughly $1.63 in credit market debt for every dollar in disposable income.
According to Stats Can:
Households borrowed $27.4 billion in the third quarter, principally mortgages. Total household credit market debt (consumer credit, mortgage, and non-mortgage loans) rose 1.5% to $1,805 billion at the end of the third quarter, matching the gain of the previous quarter. Consumer credit debt increased 0.9% to $515 billion, while mortgage debt was up 1.8% to $1,171 billion.
Disposable income increased at a slower rate than household credit market debt in the third quarter. As a result, leverage, as measured by household credit market debt to disposable income, reached 162.6% in the third quarter, versus a revised 161.5% in the previous quarter. In other words, households held roughly $1.63 of credit market debt for every dollar of disposable income in the third quarter. The household credit market debt to disposable income ratio was revised downward, from the first quarter of 2011 to the second quarter of 2014, as part of the regular national balance sheet and financial flow accounts annual revision process. The revision was due to new information received that led to a downward revision to the value of mortgages owed by households. (source, Stats Can)
Household sector leverage indicators
If your debt is overwhelming you – contact the professionals at Boale Wood for a free consultation.

