• Skip to primary navigation
  • Skip to main content
  • Skip to primary sidebar
  • Skip to footer

Phone: (604) 605-3335  Toll Free: (888) 850-6585


Boale, Wood and Company

Boale, Wood and Company

Licensed Insolvency Trustee

  • Our Company
    • Why Use Us
    • David Wood
  • Solutions
    • Personal Solutions
      • Alternatives to Bankruptcy
      • Consumer Proposal
      • Consumer Proposal vs. Debt Management Program
      • Division 1 Proposal
      • Personal Bankruptcy
      • Proposal Comparison
    • Corporate Solutions
      • Bankruptcy
      • Debt Restructuring
      • Informal Workouts
      • Creditor Proposal
      • Receiverships
      • Liquidator Strata Wind Ups
      • Court Appointed Administrators
  • Resources
    • Forms
    • Newsletter
      • Newsletter Archive
    • Social Media
    • Media
    • FAQ
    • Articles
    • CAIRP
    • Privacy Policy
  • Blog
  • Ask a Trustee
    • Submit your Question
  • Contact Us
    • Free Initial Consultation
    • Vancouver Office
    • Surrey Office
    • Yukon Territory

Canadian household debt goes even higher

March 12, 2016 by admin

cg160311b002-eng

The latest from Statistics Canada echoes its last few reports – Canadian household debt continues to grow.

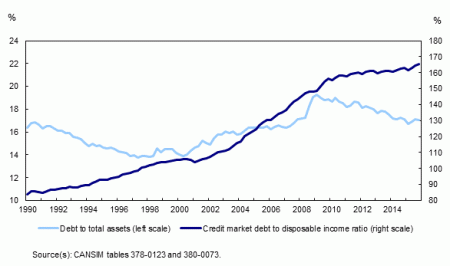
Canadian households, on average, held $1.65 in credit market debt for every dollar of disposable income.

In its National Balance Sheet and Financial Flow Accounts (Q4, 2015) Stats Can says that:

Total household credit market debt (consumer credit, and mortgage and non-mortgage loans) reached $1,923 billion at the end of the fourth quarter, up 1.2% from the previous quarter. Consumer credit debt was $573.6 billion, while mortgage debt stood at $1,262 billion. Over the year, households increased their mortgage liabilities by $74.4 billion, a rise of 6.3% from the previous year, and the strongest growth since 2011.

The ratio of total household debt to total assets was largely unchanged in the fourth quarter, edging down to 17.1%. This ratio sits between the peak of 19.3% recorded in the first quarter of 2009 and the low of 13.8% in the second quarter of 1997.

The ratio of household credit market debt to disposable income (excluding pension entitlements) rose to 165.4% in the fourth quarter from 164.5% (revised from 163.7%) in the third quarter. In other words, households held $1.65 in credit market debt for every dollar of disposable income. Disposable income increased 0.6%, a slower pace than that of household credit market debt (+1.2%).

Y0u can see the full report here.

Related stories:

  • Globe and Mail
  • CBC.ca

Articles,  Blog,  debt

Primary Sidebar

Call Us Now

Phone: (604) 605-3335
Toll Free: (888) 850-6585
or use the Contact Form

We have offices located in Vancouver and Surrey.  We also provide services to residents and businesses in the Yukon Territory.


Looking for Forms?

We have a number of forms available for download here.

Footer

  • Email
  • Facebook
  • LinkedIn
  • Twitter