The Office of the Superintendent of Bankruptcy recently issued a report on Ten-Year Insolvency Trends in Canada. The ten year period covers 2007 – 2016. The statistics show that the trends have been fairly steady for the last 10 years with the exception of the recession of 2008 – 2009.
Consumer Insolvency Volumes
In 2009, consumer insolvency filings peaked in 2009 at 151,712, which represented 95.75% of all insolvency filings. In 2016, there were 125,878 consumer insolvency filings or 97.03% of all insolvency filings. Insolvency filings have been decreasing since 2009 but have remained somewhat constant since 2011.
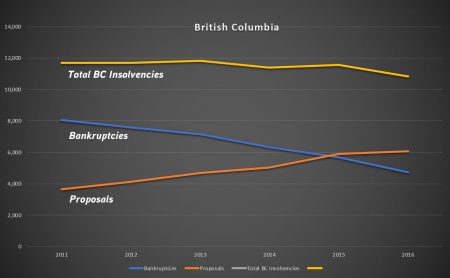
In BC, consumer insolvencies since 2011 have remained fairly constant as follows:
British Columbia | 2011 | 2012 | 2013 | 2014 | 2015 | 2016 | |
| Bankruptcies | 8,040 | 7,562 | 7,130 | 6,345 | 5,683 | 4,719 | |
| Proposals | 3,636 | 4,134 | 4,672 | 5,038 | 5,897 | 6,087 | |
| Total BC Insolvencies | 11,676 | 11,696 | 11,802 | 11,383 | 11,580 | 10,806 | |
| % Consumer Insolvencies in Canada | 9.49 | 9.87 | 9.94 | 9.64 | 9.52 | 8.58 |
As is apparent, although the number of filings remains constant, the number of proposals has increased from 31.14% in 2011 to 56.32% in 2016. This is slightly ahead of the rest of Canada but in line with all statistics across the board.
In terms of age demographic, the report breaks down insolvency filings by age group as a percentage of insolvency filings as follows:
| Age | 2011 | 2012 | 2013 | 2014 | 2015 | 2016 |
| 18 - 24 | 2.7 | 2.6 | 2.9 | 2.9 | 3.1 | 3.3 |
| 25 - 44 | 46.5 | 46.1 | 45.5 | 45.2 | 45.0 | 45.2 |
| 45 - 64 | 41.7 | 42.2 | 42.1 | 41.9 | 41.5 | 40.6 |
| 65 + | 9.1 | 9.1 | 9.5 | 10.0 | 10.4 | 10.9 |
All numbers are expressed as a percentage of consumer insolvency filings. Of particular note is the upward trend in 18 – 24 age group and in the 65+ age group.
In terms of gender, slightly more males than females filed for insolvency throughout the period, a trend consistent for both bankruptcy and proposal filings.
Liabilities
One statistic that should be of no surprise to anyone is the fact that consumer debt loads have been rising since 2007. The Bank of Canada has stated on numerous occasions its concern with the debt levels consumers are carrying and the trend towards rising interest rates. Overall, declared liabilities in 2007 were approximately $7.5 billion rising to $15 billion in 2016. In 2016, this averages out to slightly less than $120,000 per insolvency throughout Canada.
The table below illustrates the average debt load of consumers between 2007 and 2016 segregated between bankruptcies and proposals.
| Bankruptcies | # Filings | Average Debt Load | Proposals | # Filings | Average Debt Load | |
| 2017 | $5,548,253,262 | 79,847 | $69,486 | $1,967,758,877 | 21,446 | $91,754 |
| 2016 | $7,537,496,082 | 63,372 | $118,940 | $7,527,910,339 | 62,506 | $120,435 |
Business Insolvency Volumes
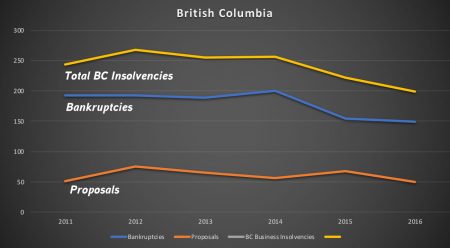
Business insolvency volumes represents only a small portion of all insolvencies in Canada. Business insolvencies decreased by 7.3% per year, from 7,612 in 2007 to 3,849 in 2016. Both business bankruptcies and business proposals decreased during this period, with proposals falling at a slower pace.
British Columbia | 2011 | 2012 | 2013 | 2014 | 2015 | 2016 | |
| Bankruptcies | 192 | 192 | 189 | 200 | 154 | 149 | |
| Proposals | 51 | 76 | 66 | 56 | 68 | 50 | |
| Total BC Insolvencies | 243 | 268 | 255 | 256 | 222 | 199 | |
| % Consumer Insolvencies in Canada | 5.08 | 6.15 | 5.95 | 6.06 | 5.40 | 5.17 |
The report hasn’t provided much more insight than what Licensed insolvency Trustees in BC already know, that consumer insolvency filings have been fairly steady in recent years and business bankruptcies have decreased substantially.
The report has been published on the OSB website and can be found here.
For more information relating to insolvency, please contact David Wood at (604) 605-3335.


